Event Analytics & Reporting for Professional Summits: Practical Solutions for Large-Scale Business Conferences
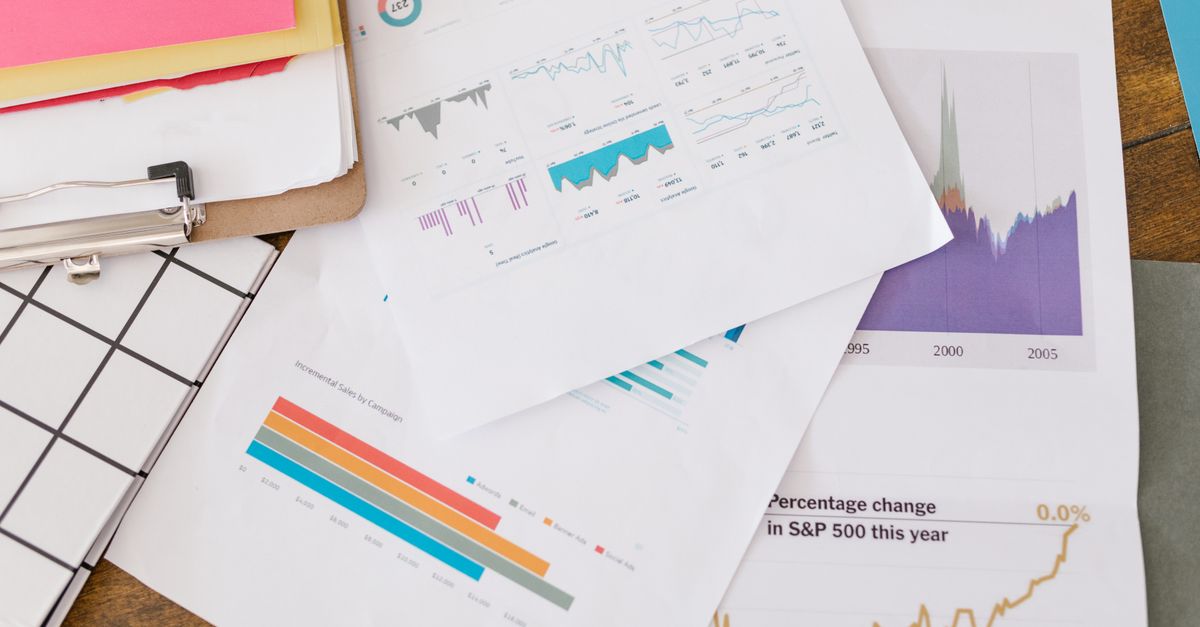
Running a professional summit today means juggling more than just speakers and sponsors. The real game‑changer is the data you collect, transform, and act on—everything from ticket sales velocity to attendee engagement in real time. In this roundtable‑style guide, I’ll walk through the essentials of building a resilient event ticketing system that fuels robust analytics & reporting for large‑scale business conferences.
1. Core Challenges in Modern Summit Analytics
First off, the sheer volume of data spikes during peak registration periods and live sessions. In a typical 10,000‑plus attendee summit, you might see hundreds of ticket purchases per minute as early‑bird deadlines loom or as last‑minute corporate blocks are sold. That surge can overwhelm traditional spreadsheet workflows, causing lag or even crashes. Many organizers fall into two traps: either they rely on manual spreadsheets that collapse under load, or they adopt a single‑vendor solution that doesn’t expose raw event data. The result? Missed opportunities to tweak marketing spend or optimize floor layouts mid‑event.
The second hurdle is integration friction. Even if you have the best ticketing platform, it’s useless without seamless flows into your CRM, email automation, and post‑conference reporting suites. I’ve seen events where data silos forced planners to rebuild dashboards from scratch every week—wasted time, wasted insights.
2. Selecting a Ticketing Platform That Supports Analytics
When choosing a ticketing system, the primary goal is API depth and real‑time webhook support. You need an endpoint that pushes every transaction instantly so dashboards stay current without polling delays. Look for built‑in segmentation—early‑bird, VIP, group tickets—because those categories are your first analytic buckets.
Another critical feature is data export granularity. Some platforms only let you pull monthly summaries; others allow event‑by‑event breakdowns down to the individual session level. The latter is indispensable when you’re trying to correlate attendee movement with speaking slots or sponsor booths.
Key Criteria Checklist for Ticketing Platforms
- Real‑time API/webhook support
- Granular data exports (session, ticket type)
- Scalable hosting (cloud‑native, auto‑scaling)
- Built‑in fraud detection & seat reservation logic
- Strong security compliance (PCI‑DSS, GDPR)
3. Designing Data Collection & Tracking Points
Once you have the ticketing engine, map out every touchpoint that generates actionable insights: pre‑event web visits, email opens, social media clicks, on‑site QR scans, session check‑ins, post‑conference surveys. Each point should emit a structured event payload to your analytics backend—think JSON with timestamp, user ID, and context.
Standardizing the schema across channels eliminates data drift. For example, use consistent naming for “session_id” whether it comes from the ticketing API or the mobile app. That consistency pays off when you aggregate metrics later in dashboards or machine‑learning models.
Essential Metrics to Capture
- Ticket sales velocity (tickets per hour)
- Conversion rates across acquisition channels
- Session attendance vs. registration (drop‑off analysis)
- Average dwell time per session
- Survey completion rates & sentiment scores
4. Building Real‑Time Reporting Dashboards
The goal of dashboards is twofold: operational visibility and strategic decision support. Operational users need live data on ticket sales, check‑in queues, and room occupancy. Strategic stakeholders require trend analysis—ticketing revenue vs. marketing spend, attendee satisfaction heatmaps, ROI per speaker.
When designing, start with the most critical KPI widgets and iterate. Use a mix of bar charts for volume, line graphs for trends, and heat maps for spatial data. Keep interactivity minimal to avoid cognitive overload—filters should be pre‑set for common scenarios (e.g., “last 24 hours” or “VIP cohort”). Consider adding a small “pulse” indicator that highlights sudden spikes in check‑in queues so operations staff can react instantly.
Dashboard Component Blueprint
- Live ticket sales counter with trend arrow
- Geospatial attendee map (floor plan overlay)
- Session attendance heatmap by time slot
- Marketing channel performance chart
- Sentiment analysis bar for post‑event feedback
5. Integrating Ticketing with CRM and Marketing Automation
Data isolation kills engagement. Your ticketing system must push attendee profiles into your CRM in real time, tagging them by ticket type, session interests, and behavioral flags (e.g., “high‑value lead”). This enables personalized email flows—welcome series, upsell offers, or post‑conference thank‑you notes that increase retention.
Conversely, pull marketing data back into the ticketing platform for dynamic pricing strategies. For instance, if a particular email campaign is driving high conversion rates, you can temporarily boost early‑bird pricing to capitalize on momentum while monitoring the impact in real time.
Integration Touchpoints
- Profile sync (name, email, company, role)
- Ticket metadata tagging (VIP, group, sponsor)
- Event participation history for loyalty scoring
- Marketing attribution data (UTM parameters)
- Post‑event survey results feeding into CRM notes
6. Scaling & Performance Considerations for Large-Scale Events
Large conferences—think 10,000+ attendees—push every system to its limits. The ticketing backend must handle peak concurrency without latency spikes. Deploy the service in a multi‑region cloud architecture with auto‑scaling policies tied to request rates.
For analytics pipelines, leverage event streaming platforms (Kafka, Pub/Sub) that buffer bursts and guarantee message delivery. Store raw events in a data lake for batch processing while feeding a real‑time warehouse (Redshift, BigQuery) for instant queries.
Scalability Checklist
- Auto‑scaling compute resources based on request rate thresholds
- Load balancing across multiple API gateways
- Stateless ticketing microservices to ease scaling
- Event streaming with back‑pressure handling
- Distributed caching for high‑frequency metrics
7. Cost & ROI Calculation for Event Technology Investments
Technology costs can quickly balloon if you’re not mindful of scope creep. Start with a baseline budget that covers the ticketing platform, analytics infrastructure, and integration work. Add contingency for unexpected scaling needs—especially during peak registration windows.
ROI is often measured in two ways: direct revenue from tickets and indirect value from data‑driven decisions. Quantify savings from optimized marketing spend (e.g., reducing CPA by 15%) and increased attendee satisfaction leading to repeat registrations. A simple formula: (Revenue Increase + Cost Savings) / Total Investment = ROI Percentage.
Primary Cost Drivers
- Platform licensing or subscription fees
- Cloud infrastructure (compute, storage, networking)
- Integration development hours
- Data warehouse and analytics tooling
- Support & maintenance contracts
8. Common Pitfalls to Avoid in Event Analytics Projects
Even with the best planning, mistakes happen. The most frequent ones include:
- Over‑engineering dashboards that never get used.
- Neglecting data quality checks—duplicate attendee IDs can skew metrics.
- Ignoring security compliance—PCI‑DSS for payment data and GDPR for personal info.
- Failing to test load scenarios before launch.
- Underestimating the time needed for CRM sync delays.
By addressing these pitfalls early, you can keep your analytics pipeline clean, reliable, and actionable throughout the event lifecycle. A disciplined approach to schema validation, continuous monitoring, and stakeholder education will turn raw numbers into strategic advantage.
What’s one metric you’ve found most valuable for making on‑the‑fly decisions during a live conference?